Air defense
Adding a fused passive sensing layer to IAMD systems
By Jaimie Brzezinski / 11.03.2026

While radar is a widespread and versatile tool for detecting and locating in the battlespace, it has a critical Achilles heel. As active systems, radars have their own EMS signature to alert the enemy that they are operational, enabling reverse targeting and destruction of the asset. In a conflict environment, active radar should be operated judiciously and has an extremely short half-life.
Passive EW systems and signal detectors
What is 3D TDoA?
What is sample-based TDoA geolocation?
What is detector-based TDoA geolocation?
Detecting RF emissions from airborne targets
Geolocating aircraft using detector-based 3D TDoA
Conclusion – the benefits of detector-based TDoA
Passive EW (electronic warfare) systems operate in stealth mode, silently and constantly monitoring RF (radio frequency) transmissions and geolocating their targets. Traditional geolocation techniques (such as AoA or sampling-based TDoA) works well with cooperative signals from static targets, but many techniques exist to ensure that signals from high-value assets such as enemy aircraft, jamming systems, missiles, or drones are less than cooperative. These range from obfuscation, utilizing frequency agile transmission techniques, and high-speed digital modulation to reduce time on air and, therefore, Probability of Intercept (PoI). Human operators do not have the luxury of time to operate against signals; hence, detection and geolocation success can be extremely low.
To effectively geolocate such non-co-operative RF emissions, software-based signal detectors developed by CRFS are a powerful method of triggering the geolocation workflow. Signal detectors operate in real-time on an RFeye Node, can extract signal information close to the noise floor, and are faster than any human operator. They enable a high level of workflow automation over a wider frequency range—and simultaneously against multiple signals. The net impact is a massive increase in PoI, detection range, and the number of simultaneous targets that can be detected and tracked in theatre.
These software-based signal detectors have a wide range of applications. This blog considers their application in enabling a key capability—detecting and geolocating airborne targets as part of a 3D TDoA geolocation workflow.
TDoA (Time Difference of Arrival) is a well-known method used to geolocate RF transmissions. Traditionally, three (or more) RFeye receivers (with omnidirectional antennas) placed in a spatially separated network derive a location in 2D (latitude and longitude) using time of flight algorithms. Data from each pair of receivers produce a curve along which the transmitter is located. The intersection between these curves is the highest probable location (latitude, longitude) of the transmission.
To extend TDoA geometry into three dimensions, using a fourth receiver increases the number of curves produced. Therefore, the algorithm is extended to allow solutions in 3D. The point where all three curves intersect provides the target's exact location: latitude, longitude, and altitude.
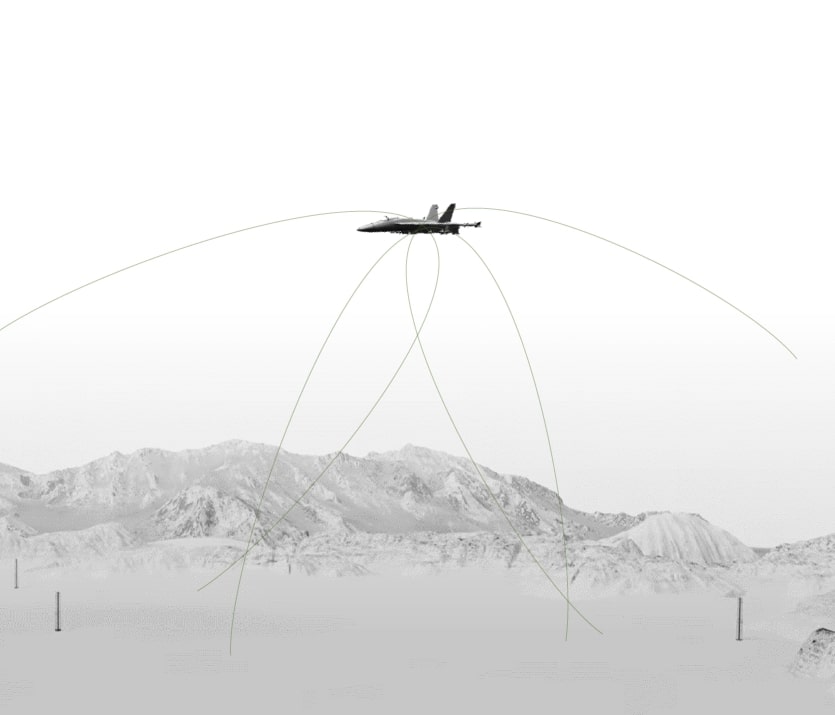
Figure 1: Graphic representation of 3D TDoA
Sample-based 2D or 3D TDoA requires a spatially-distributed network of RFeye Node receivers, sweeping the spectrum synchronously and continuously. While observing the spectrum, the operator may select a signal of interest and invoke a sampling TDoA mission in their spectrum monitoring software
Each RFeye Node samples and digitizes data from the selected frequency band. The centralized software then identifies the rise time of the signal’s pulse, performs the correlation of data from pairs of receivers, and calculates the geolocation.
After completing TDoA geolocation on one signal, the human operator can sequentially sample the next signal of interest. Clearly, manual verification of known bands is relatively slow, and the human operator cannot sample the whole spectrum as the software does not know the exact signal of interest they want to operate against.
Moreover, sample-based triggering is non-discriminatory (it blindly processes the samples given to it), so it attempts to operate against any signal it sees in the chosen frequency band. This is problematic when attempting to work over a large frequency range, as many different signals will be present, and the system will default to operate against the strongest signal. It is particularly difficult to identify signals of interest if the frequency band is congested or if there is a high noise floor.
The key to successful sample-based 2D or 3D TDoA is an expert human operator who must first select the correct spectrum band and then manually identify and invoke the sampling TDoA mission around the single of interest only.
While sample-based triggering is useful for geolocating signals in an uncongested spectrum, it is only efficient if the operator has reliable intelligence, is highly trained, selects the correct frequency band, and is able to operate at a relatively slow pace. The method is inefficient if the signal is agile or pulsing.
It is possible to automate sample-based triggering using a mask-based trigger system. Masks are very useful when there is low signal occupancy and a very low noise floor, as they allow spectrum analyzers to focus on a few signals of interest; however, they are less useful in a frequency band with high occupancy, congestion, or with a high noise floor.
When the spectrum is congested, it is difficult to effectively discriminate between signals of interest, spurious noise, or false positives when automating sample-based triggering.
Detector-based 2D or 3D TDoA triggering is a powerful tool for identifying and geolocating a wide range of signals of interest.
While ground-based receivers (Nodes) continuously sweep the spectrum, the signal detector software operates on the receiver itself, analyzing any signals in real-time. The signal detector software analyzes the captured pulses—comparing the live data against the signal detector characteristics. If these characteristics match a preset series of predefined parameters, the software then reports the detection of a signal of interest. Using software detectors is a highly precise and deterministic method of identifying a signal of interest—as long as the user has prior knowledge of the signal, or class of signals, they are hunting.
When the detector makes a positive detection (discriminating the signal of interest from every other signal), it automatically triggers and drives a predetermined workflow in the spectrum monitoring software, requesting data on the exact timestamp and frequency from every Node in the network in order to operate its TDoA process.

Airborne targets, from military jets to commercial off-the-shelf drones, have a range of well-defined RF-emitting instruments. Armed with this knowledge, the operator can invoke signal detection missions specifically tuned for those signals. When the detector recognizes the signal (discriminating known signals from all other signals), it “fires” and triggers the 3D TDoA workflow to geolocate the moving aerial object.
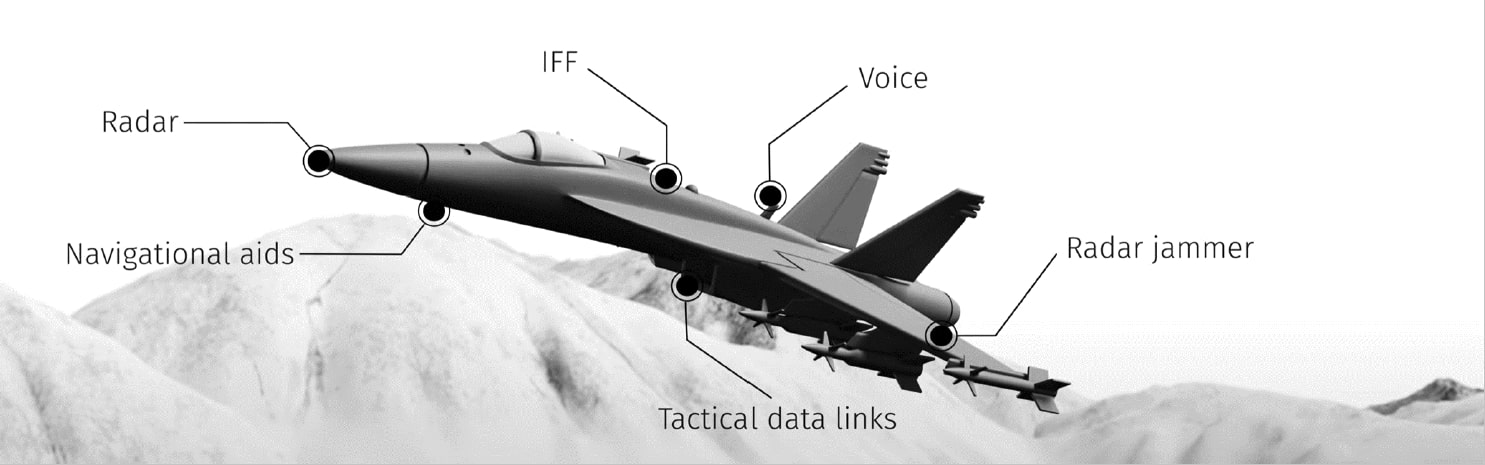
Figure 2: Sources of RF emissions from an F-16.
Of course, during active engagements, military planes turn off as many beacons as possible to control emissions; however, there are still many signatures on an aircraft.
Table 1: Frequency bands for an F-16’s RF-emitting devices
|
Radar |
Typically between 8.0 – 12.0 GHz |
|
Tactical data links |
Tactical data links can operate across various frequency bands, including L-band, S-band, C-band, and Ku-band. Link 16 operates on the UHF band. |
|
IFF (Identification Friend or Foe) |
Most commonly within the L-band or the S-band. |
|
Voice communication |
Typically in the VHF and UHF bands. |
|
Radar jammer |
Common bands include S-band, C-band, and X-band. |
|
Navigational aids |
Navigational aids can use various frequency bands, depending on the specific system, such as VHF Omnidirectional Range (VOR) in the VHF band or Instrument Landing System (ILS) in the UHF band. |
Table 2: Common RF-emitting components in drones and the frequency bands they may use
|
Remote transmitters
|
The most common frequency band used for military drone control is UHF. |
|
Telemetry data |
Specific frequency bands used vary between different military drone models, but common frequency bands used to transmit telemetry data are the UHF, S-band, and L-band. |
|
Video transmission |
Military drones commonly use frequencies within the L-band, C-band, and Ku-band. Commercial drones use ISM bands at 2.4 GHz and 5.8 GHz. |
|
GPS |
GPS used in military drones operates on the same frequency as the civilian GPS: L1 band. |
|
Tactical data links |
Tactical data links can operate in different frequency bands, including L-band, S-band, and C-band |
CRFS has produced out-of-the-box detectors with specific time and frequency characteristics written for specific signals emitted by technologies, including ADS-B, IFF, TACAN, and Link16. However, the company can also provide air defense units with generic energy and pulse detectors so they can build proprietary libraries of signal detectors based on their own specific signals of interest.

As commercial aircraft’s ADS-B, IFF, and DME (TACAN) transponders are switched on permanently, geolocating them using detector-based 3D TDoA is a simple process. In the CRFS demo network, planes are accurately detected and tracked up to 400 kilometers from the Node network—located at ground level.
In this example, four different signal detectors analyze spectrum for the specific parameters of these signals of interest. Once triggered, the software then performs each signal's arrival time difference and calculates the geolocation as described previously. With over one hundred geolocation cycles per second, it is possible to provide tracking on all the aircraft present in the airspace.
Figure 3 below shows multiple geolocation results with date and time frequency and latitude, longitude, and altitude. The green squares on the map show signals from ADS-B at 1090 MHz, light blue squares are the IFF transponder at 1090MHz, and the blue triangles show TACAN (or DME) signals, which are operating in one of 252 channels from 960 to 1230MHz.
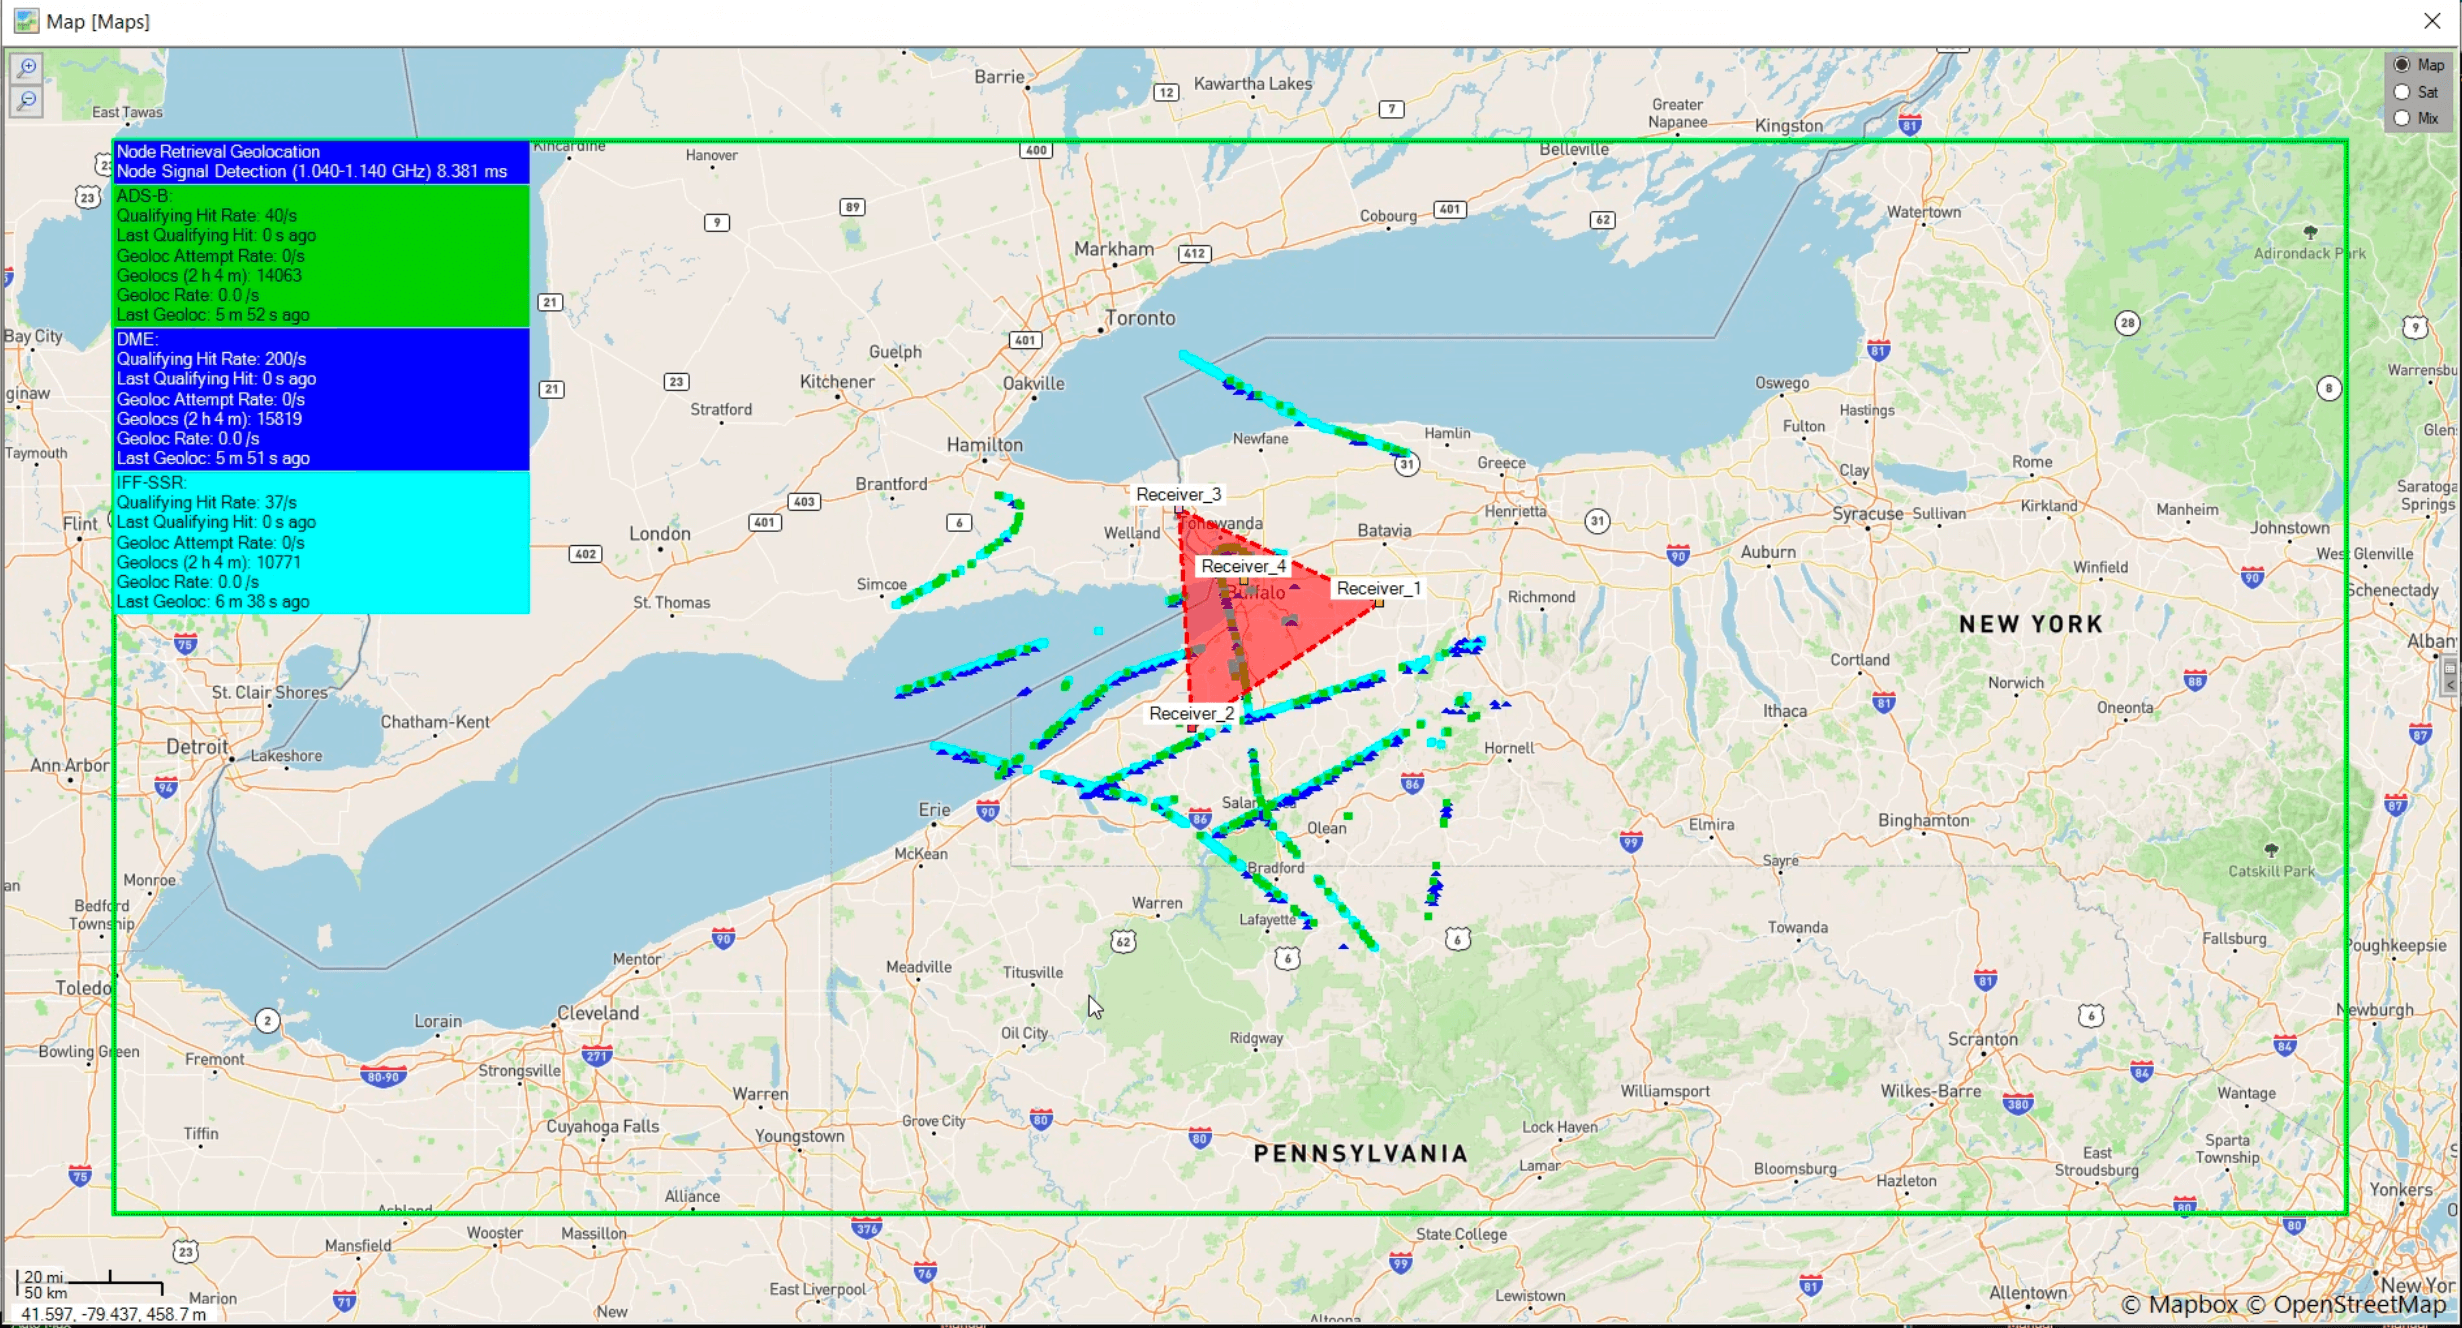
Figure 3: Geolocation of commercial aircraft over Buffalo, NY.
This example illustrates a number of key advantages of the signal detector-based methodology. Sampling-based TDoA would not be able to discriminate between two signals simultaneously operating on the same frequency (co-frequency). However, as ADS-B and IFF signals have different characteristics, the signal detectors match these characteristics and can easily discriminate between them, even if they are co-frequency.
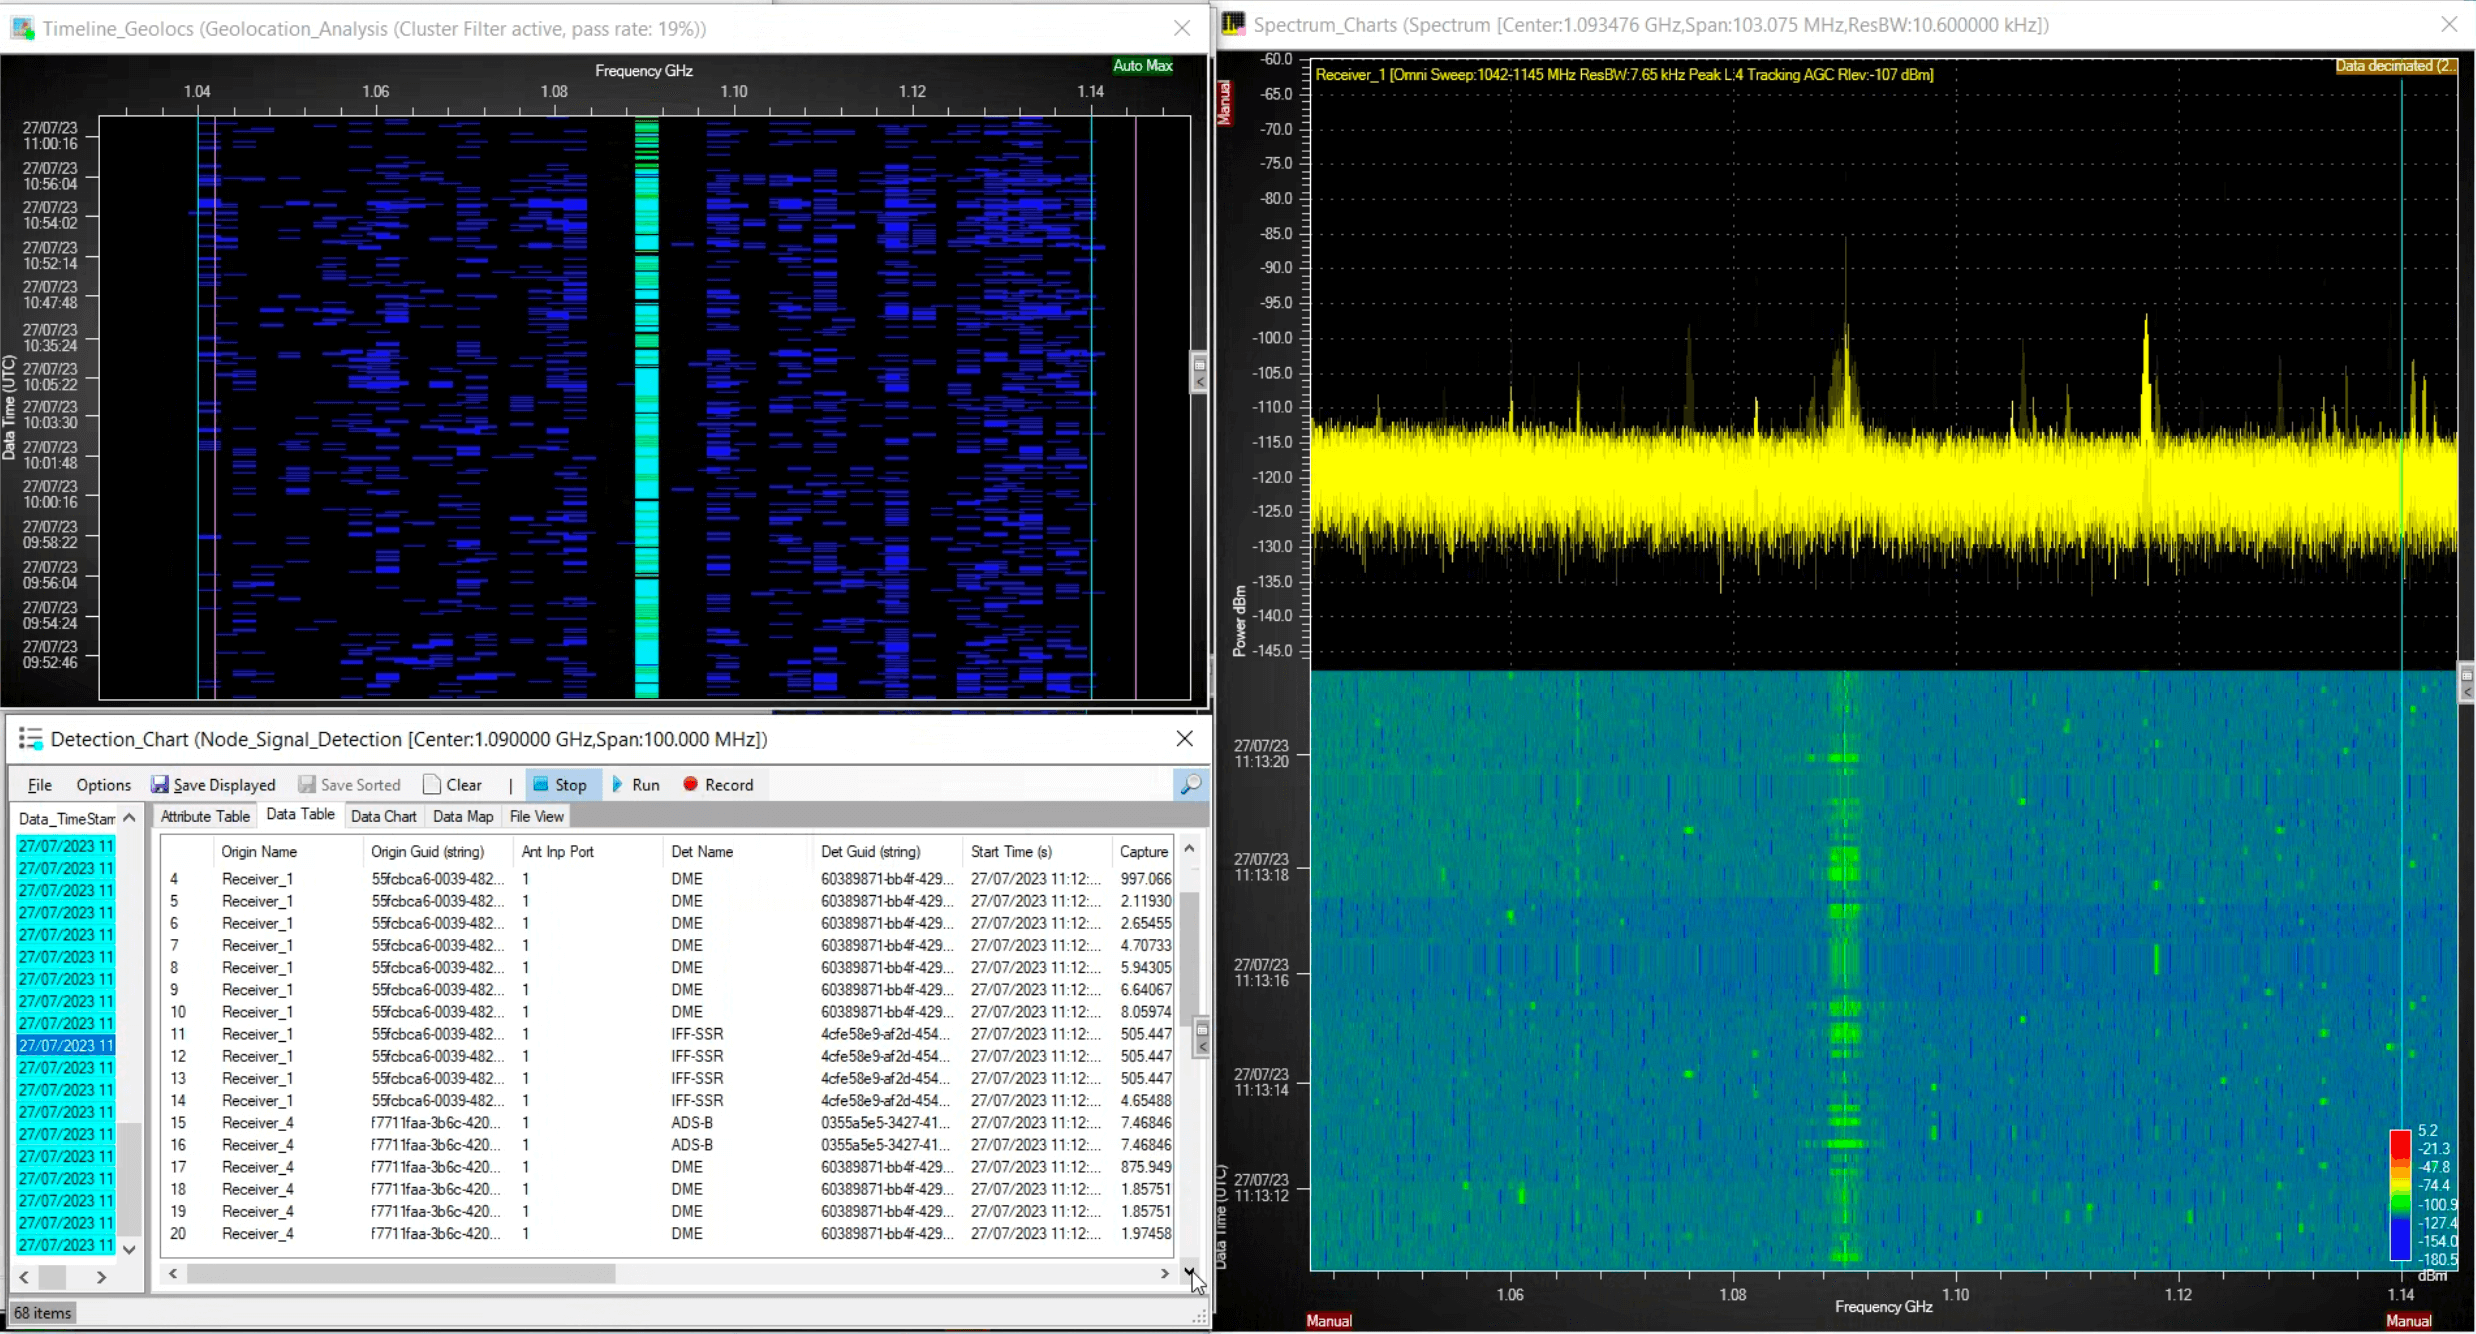
Figure 4: Waterfall showing co-frequency at 1090 MHz
TACAN signals are very narrow bandwidth and have rapid pulses. They can operate in a frequency agile manner and can appear on one of 250 plus channels across the frequency band. A human operator will struggle to see TACAN signals on the spectrum, never mind being able to react in time to invoke a geolocation mission. Therefore, trying to carry out sampling TDoA on TACAN signals will produce indiscriminate results. Geolocations triggered by signal detectors will provide high discrimination between induvial pulses and are fast enough to operate against every pulse.
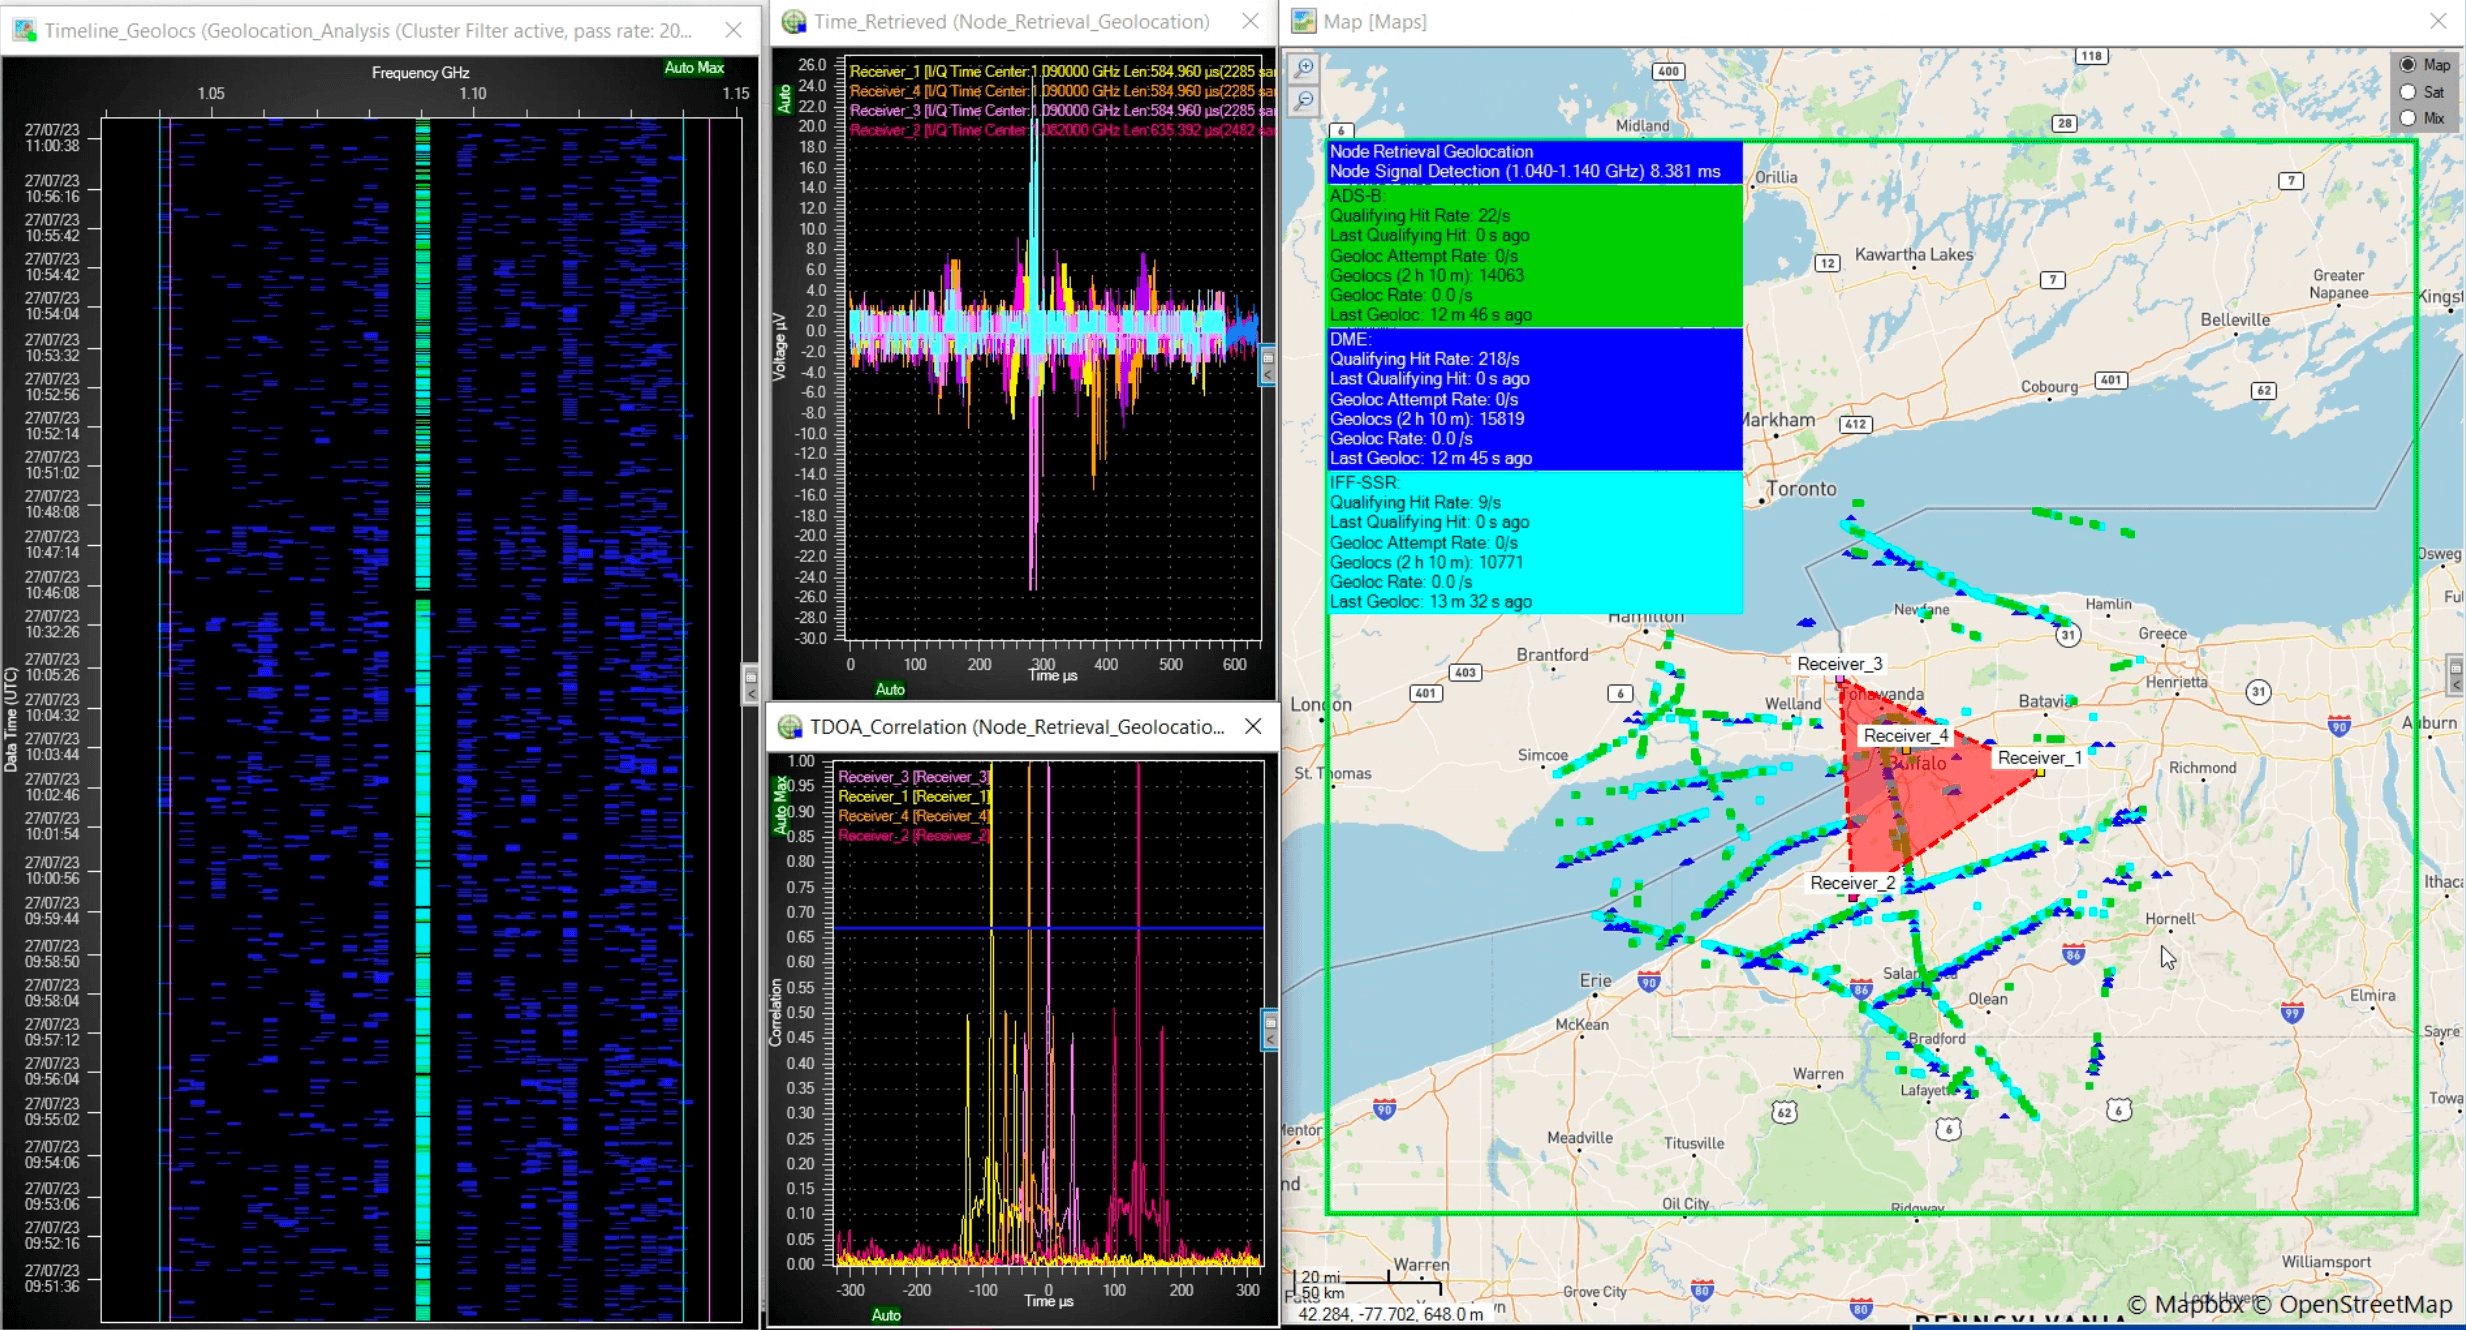
Figure 5: Full workflow in action (left, detection waterfall; top, I/Q data from each Node; bottom TDoA correlation; right, graphical display of accumulated geolocations.
Note that each airframe is building a track based on geolocation data from a range of different transponders on board, as illustrated below.
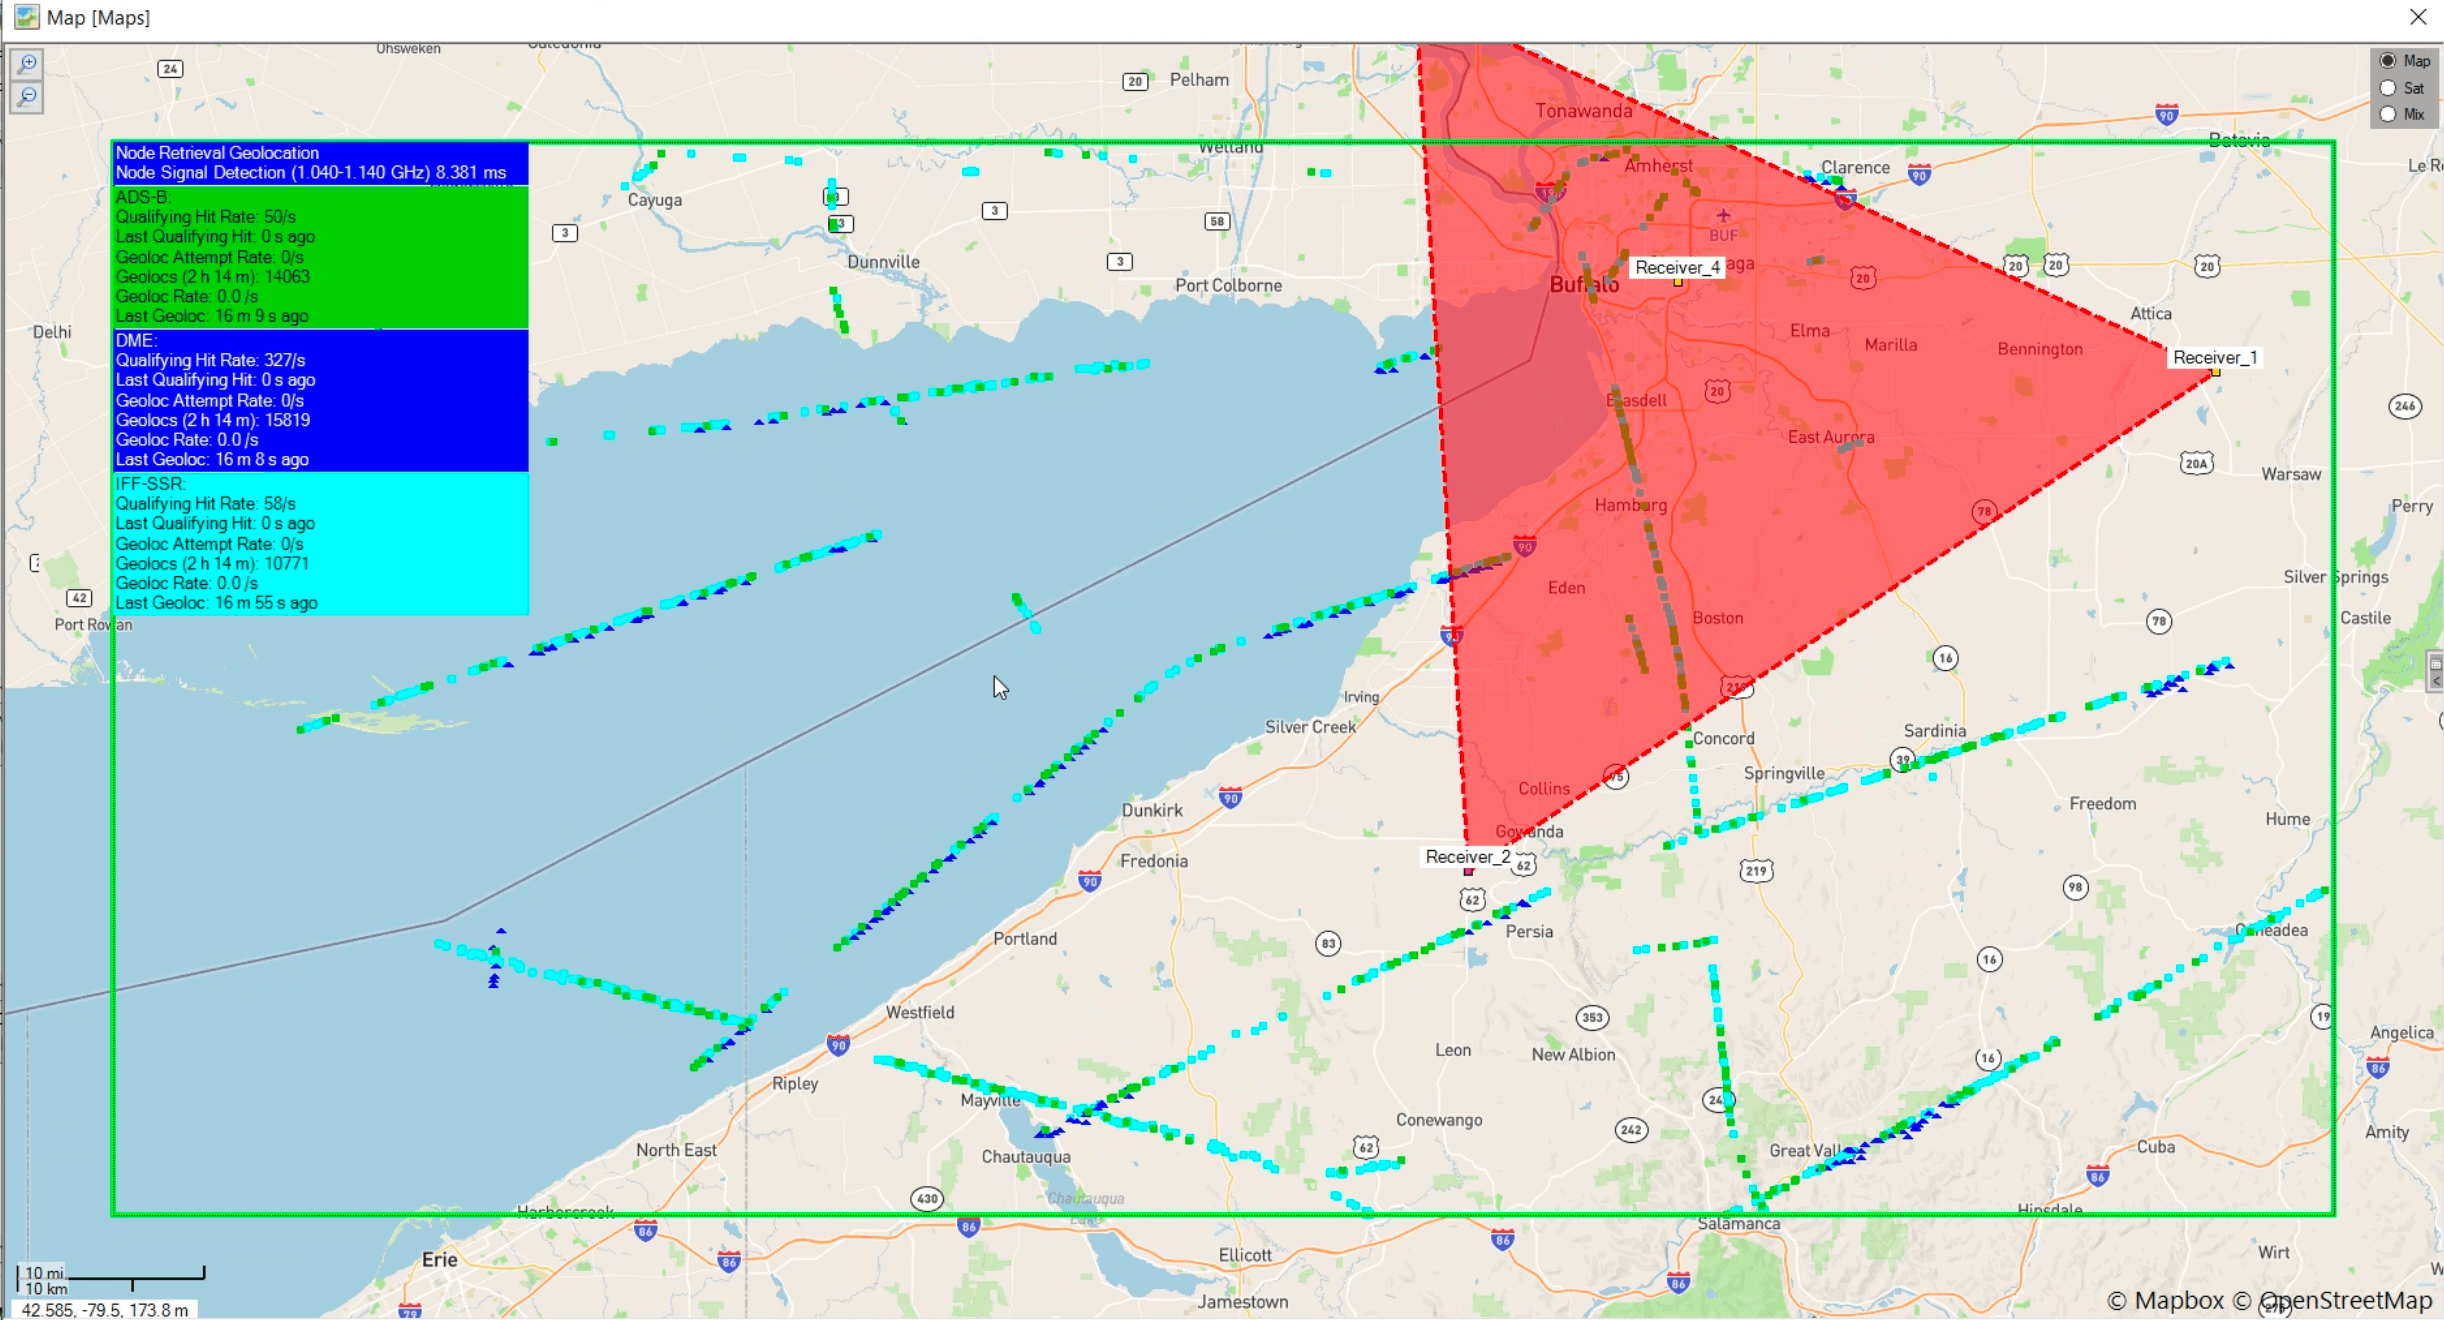
Figure 6: Tracks based on geolocation data from a range of different transponders
These geolocation data can be colored against a range of filters; a common request is by timestamp—red for older, blue for newer (as seen in the example below). With this information, it is possible to get a sense of how individual tracks can be derived. This data can be streamed live from the CRFS system into a command/control platform to fuse with other data sources and build a common operating picture using the high-value 3D geolocation data derived from this passive tracking system.
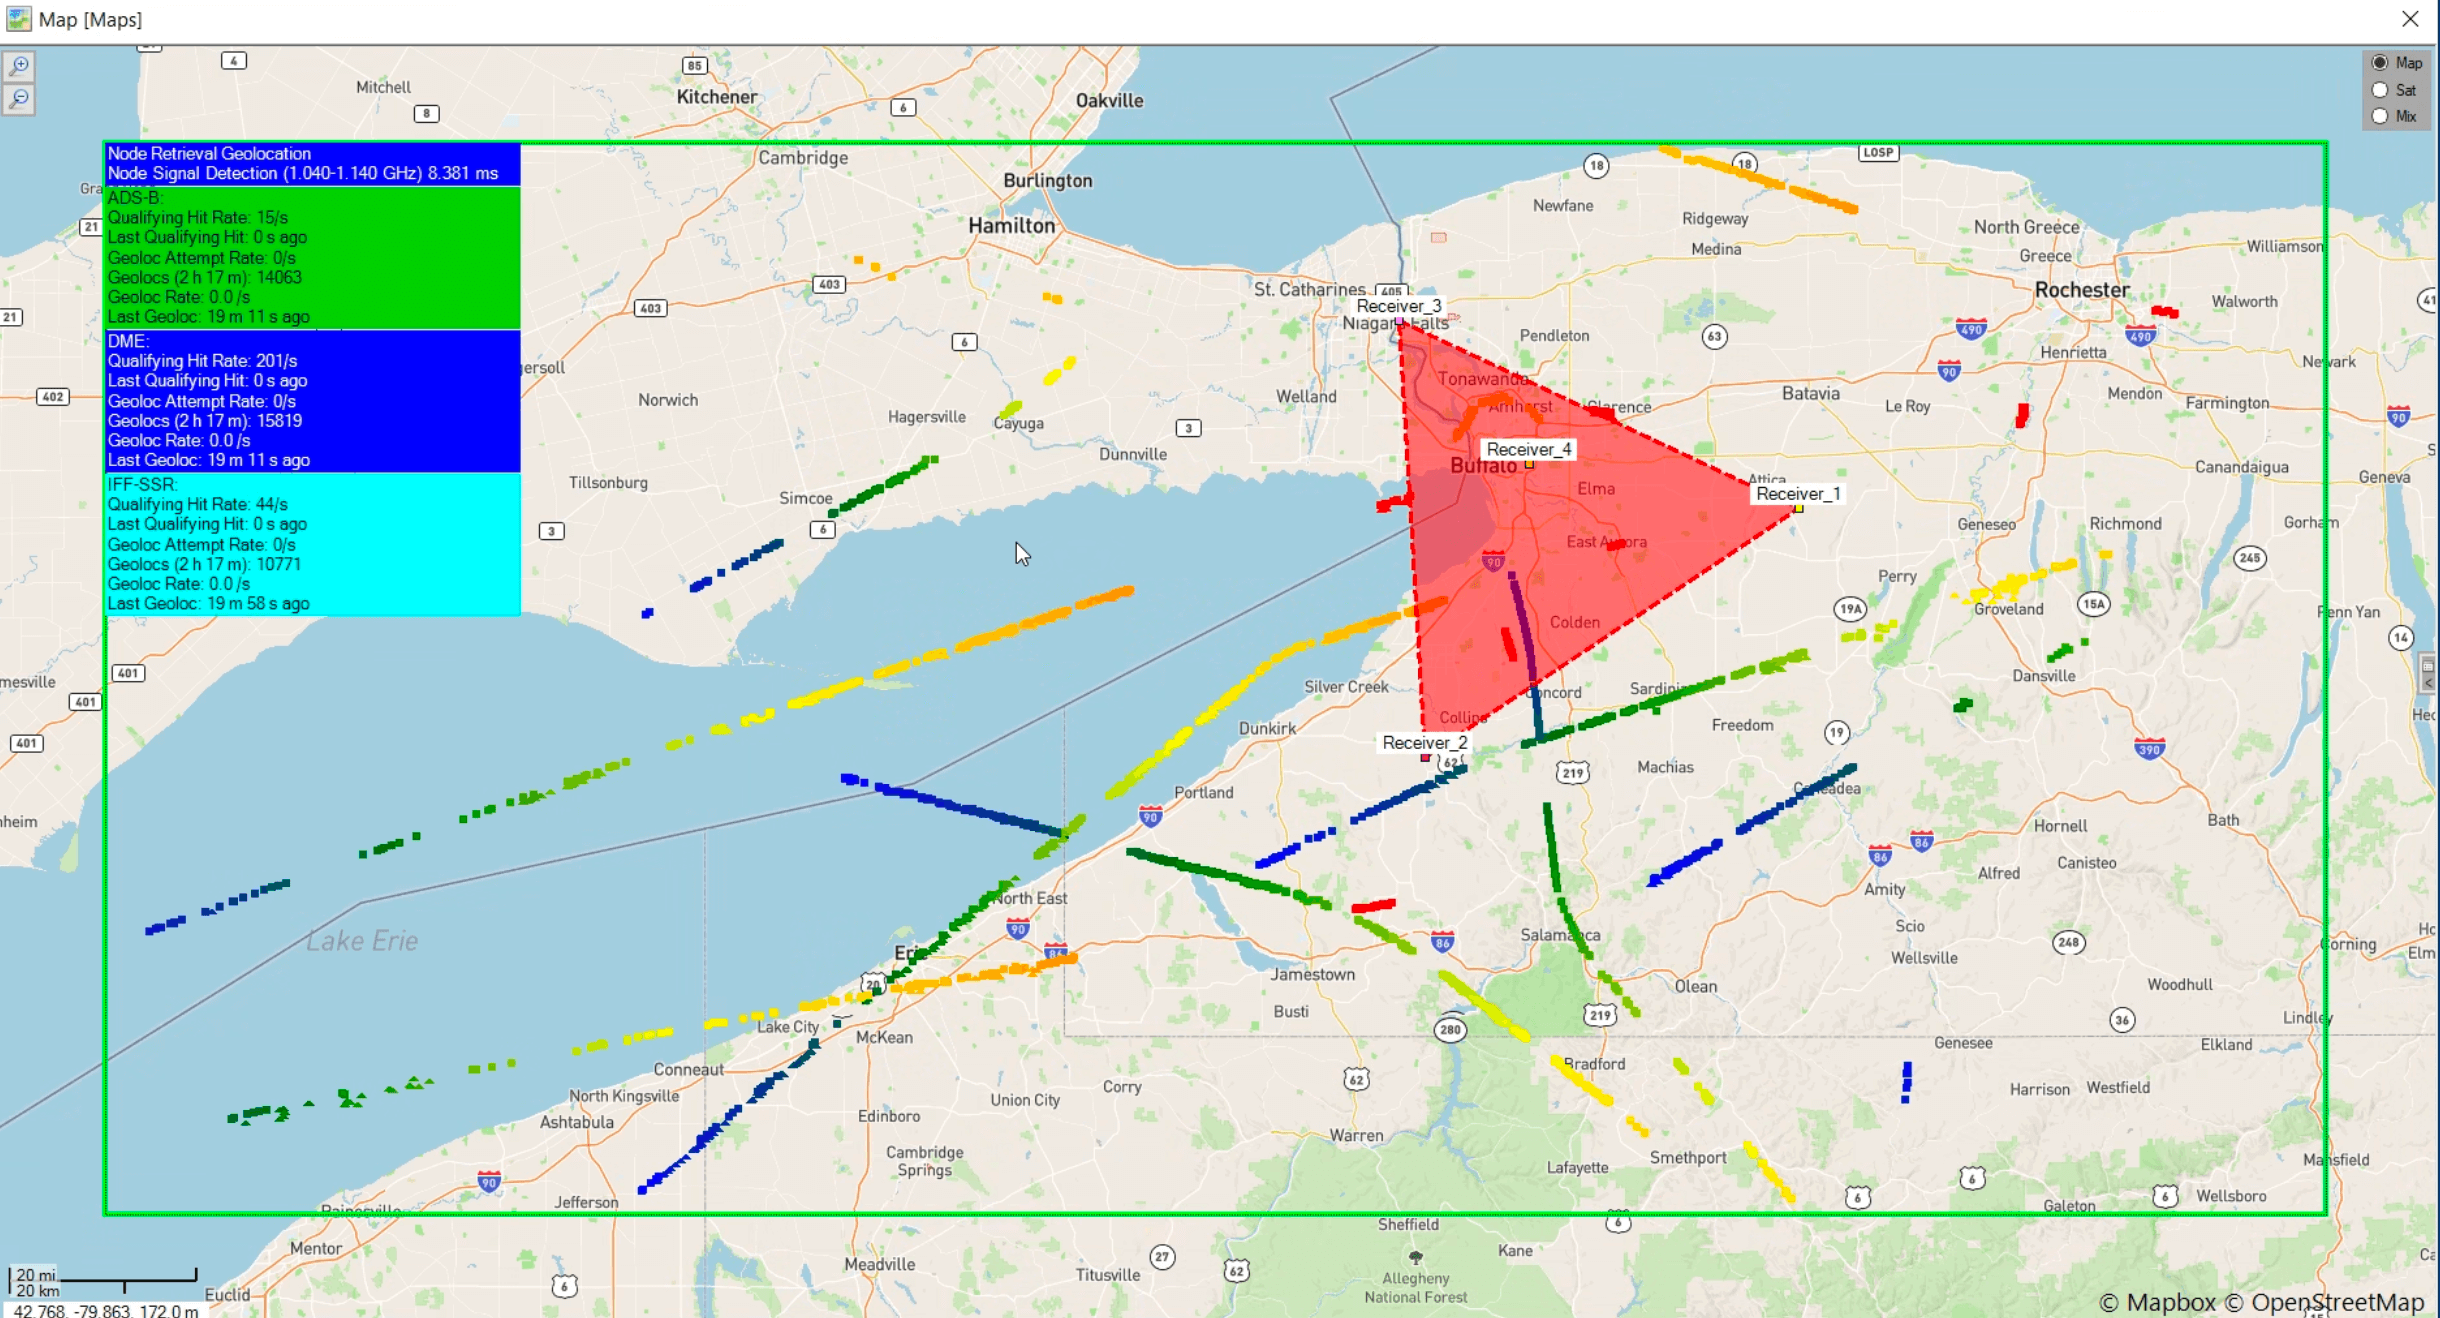
Figure 7: Geolocation data colored against timestamp
A final note, in this example, we have used the “out of the box” detectors for some common signal types. The full capability includes generic energy and pulse detectors, which the operator can use to tune and operate against any specific signal of interest.
Effective sample-based TDoA geolocation missions depend on highly-skilled operators working with accurate intelligence in an uncongested spectrum with a low noise floor. The method might be suitable for spectrum managers monitoring the GPS band for jamming signals, but operators working in air defense or counter UAV are not afforded such luxuries.
Successfully detecting and geolocating airborne targets can only be achieved by automatically analyzing a wide frequency range and discriminating multiple different signals from a forest of congested spectrum. Automation allows these processes to be performed at incredible speed, delivering actionable intelligence in real-time. What's more, these systems are completely passive: see without being seen, detect without being detected.
A comprehensive software suite to monitor, capture, analyze, geolocate, and report signals of interest. Our solution provides teams with complete and complementary tools for spectrum visibility.
Join thousands of professionals who subscribe for exclusive insights and early access to our reports and analysis.
